
Mon - Sat 9:00 - 17:30
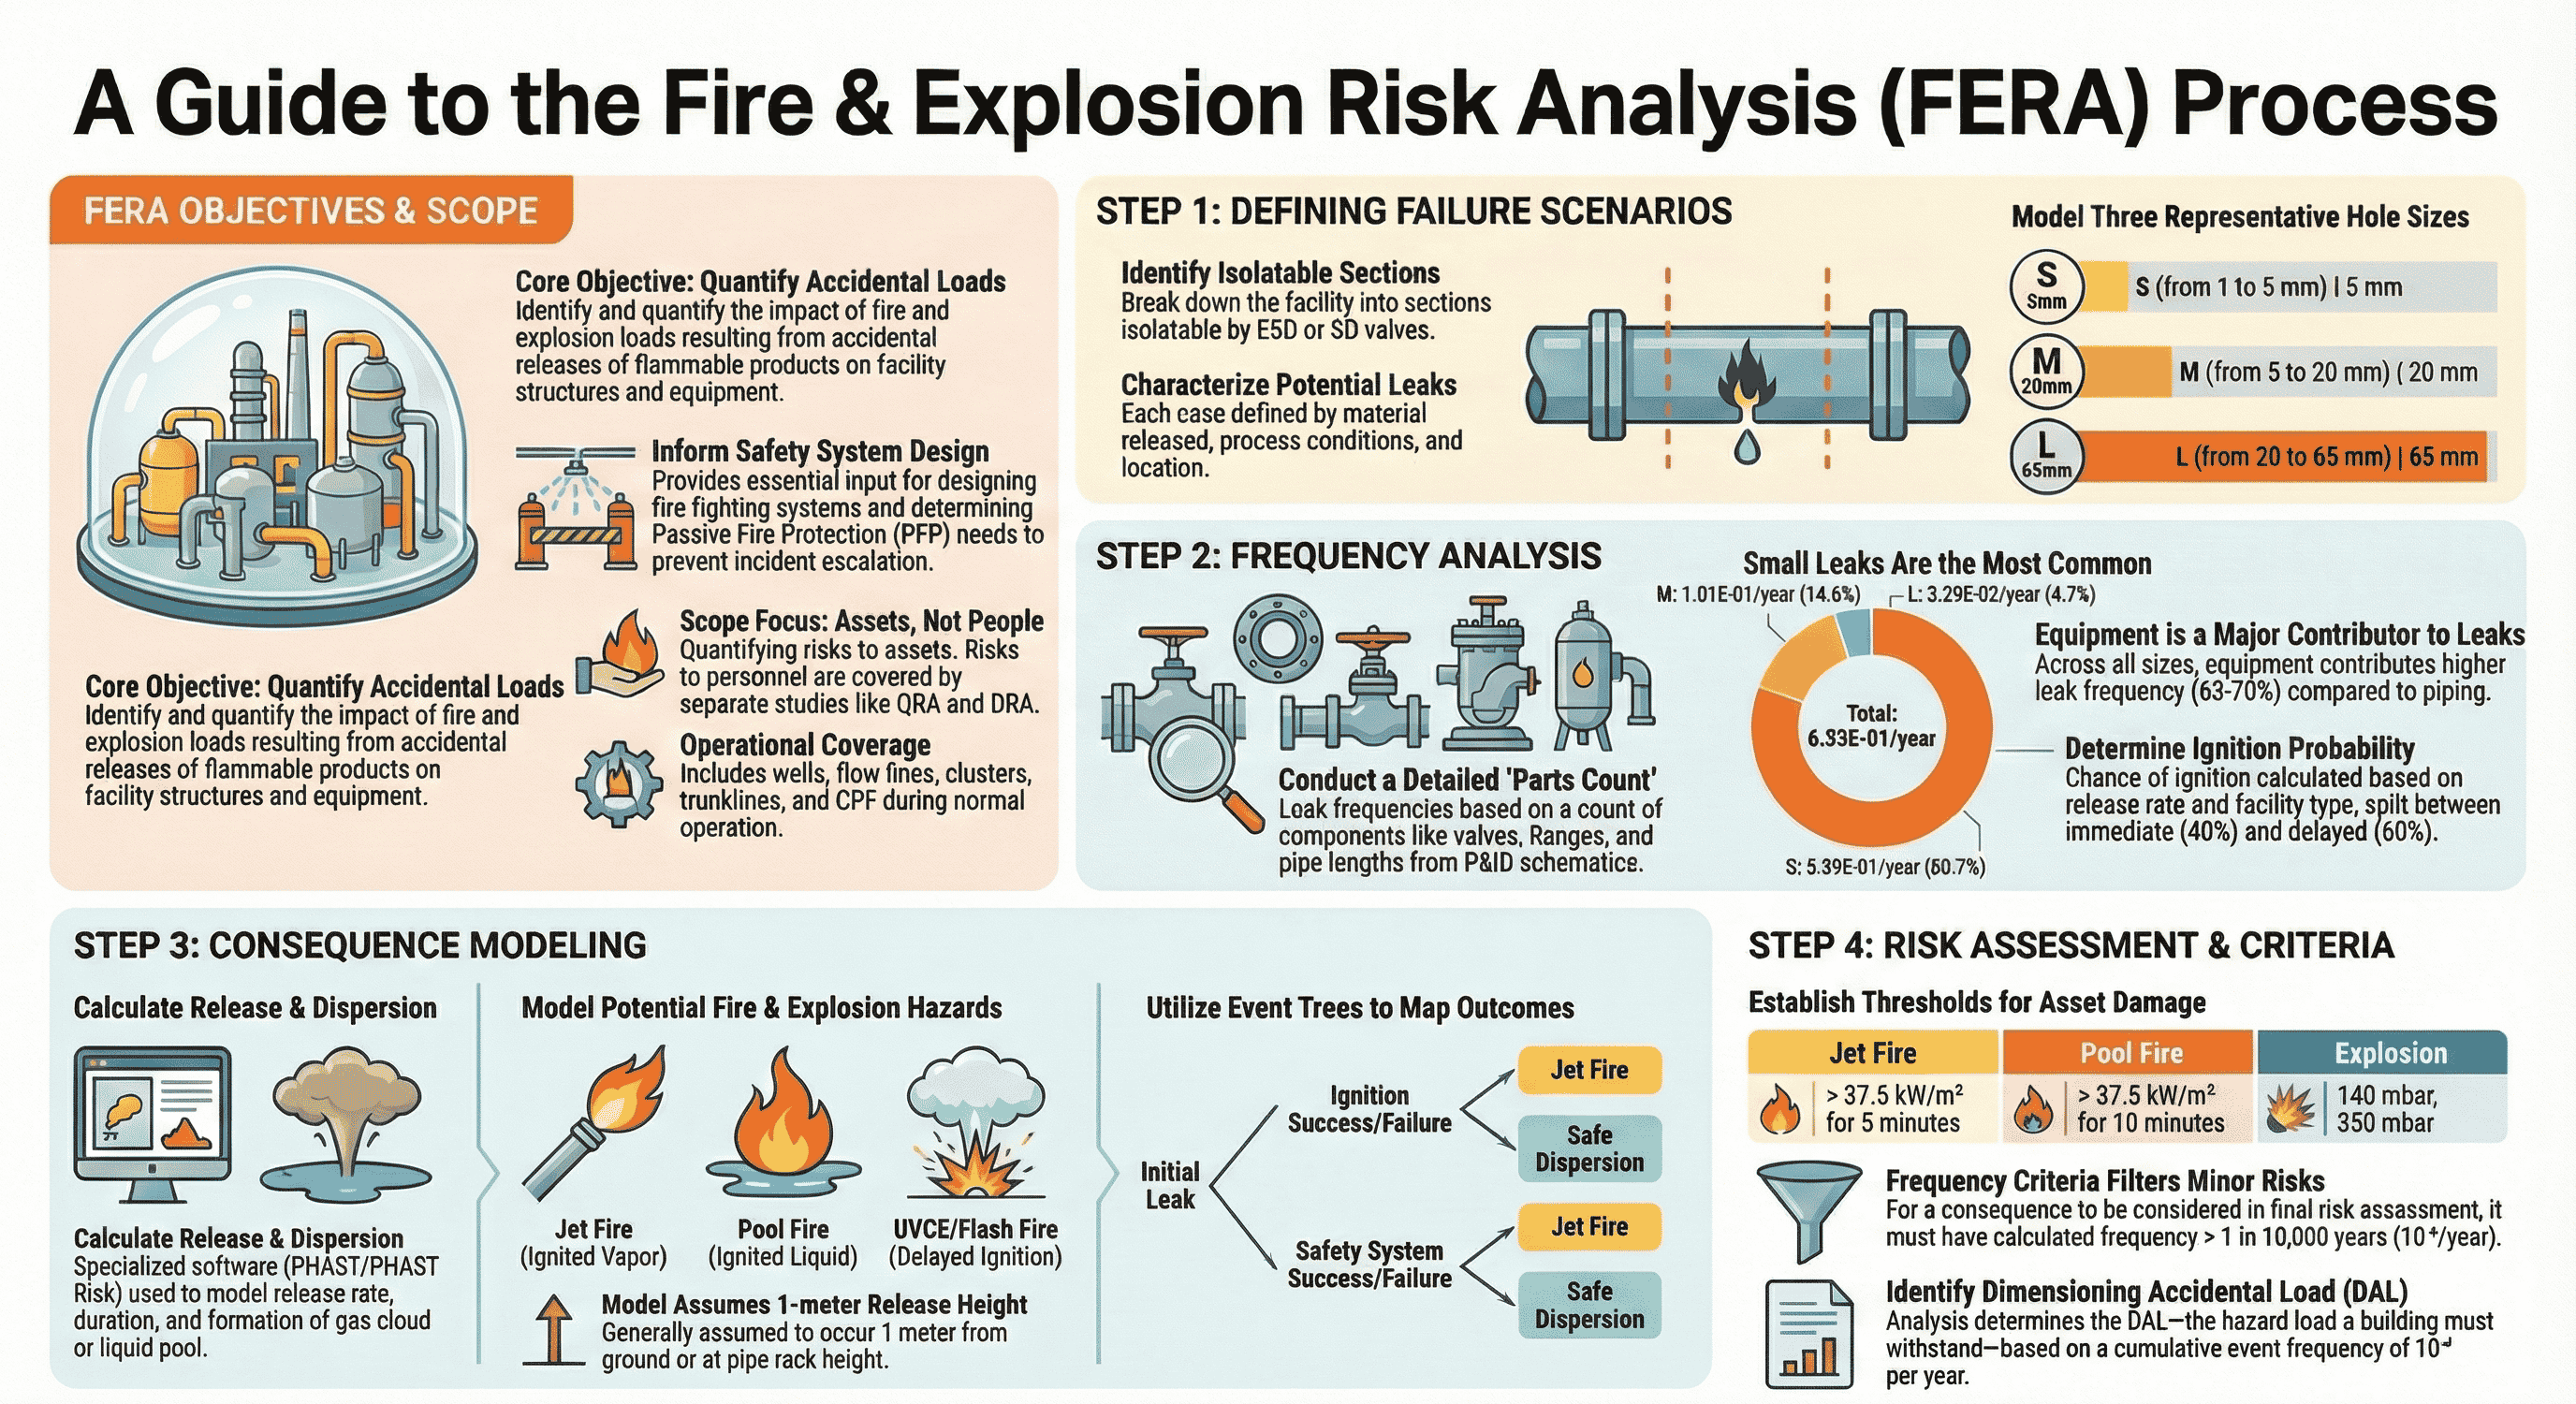
Fire and Explosion Risk Analysis (FERA) is a systematic process used in process safety engineering to understand and manage the potential for fires and explosions at industrial facilities. In simple terms, it's a detailed study that identifies what could go wrong, how likely it is to happen, and what the consequences would be. The primary goal of a FERA is to quantify these risks to protect the facility's equipment and assets, ensuring a safer operational environment.
A FERA is conducted with three primary objectives in mind, each contributing to the overall safety and integrity of a facility.
These objectives guide the entire analysis, which begins by carefully defining the scope and the core assumptions of the study.
Before the analysis can begin, its boundaries must be clearly established through a defined scope and a set of foundational assumptions.
The "scope" of a FERA defines exactly what is being studied and under what conditions. This ensures the analysis is focused and its results are correctly interpreted. For this type of study, two key limitations are established:
A FERA is a complex modeling exercise that relies on a set of approved assumptions to proceed. These assumptions provide a consistent foundation for the calculations and cover three main areas:
With the scope and assumptions in place, the analysis can move forward with a detailed, step-by-step methodology.
The FERA methodology is a structured process that moves from identifying potential leaks to evaluating their final impact on the facility.
The first step is to break down the facility into "isolatable sections"—areas of piping and equipment that can be sealed off by safety valves. Within each section, analysts define specific "failure cases," which are potential leak scenarios. Each failure case is defined by four key factors:
Analyzing every possible leak size would be impractical. To make the analysis manageable, potential leaks are grouped into three representative sizes: Small (S), Medium (M), and Large (L).
|
Range of leak sizes |
Representative hole size |
|
Small (S, 1-5 mm) |
5 mm |
|
Medium (M, 5-20 mm) |
20 mm |
|
Large (L, 20-65 mm) |
65 mm |
"Leak frequency" is the estimated probability that a leak will occur in a given year. This is calculated by performing a detailed "parts count" of every component within an isolatable section from engineering drawings (P&IDs). This includes counting items like valves, flanges, and lengths of pipe, each of which has an associated failure rate based on industry data.
Analysis of this data reveals a key insight: small leaks are far more common than large ones.
|
Leak Size |
Frequency Distribution (%) |
|
Small (S, 1-5 mm) |
80.7% |
|
Medium (M, 5-20 mm) |
14.6% |
|
Large (L, 20-65 mm) |
4.7% |
A flammable release only becomes a fire or explosion if it finds an ignition source. The analysis models the probability of this happening, which is divided into two types:
The chance of ignition depends on several factors, including whether the product is a gas or liquid, the rate of release, and the type of facility. In a typical analysis, the total probability of ignition is further divided, for example, with 40% of ignitions assumed to be immediate and 60% delayed.
This step uses specialized software (PHAST/PHAST RISK) to model the physical effects of an ignited release. The outcome depends on whether the release is a liquid or vapor and whether ignition is immediate or delayed.
|
Release Type |
Ignition Timing |
Resulting Hazard |
|
Liquid |
Immediate |
Pool Fire |
|
Vapor |
Immediate |
Jet Fire (for long-duration releases) |
|
Vapor |
Delayed |
Unconfined Vapor Cloud Explosion (UVCE) or Flash Fire (impact on assets not considered significant for flash fire) |
An "Event Tree" is a diagram that visually maps out all the possible outcomes that can follow a single leak event. Starting with the initial leak, the tree branches out to account for different probabilities at each stage: immediate vs. delayed ignition, success or failure of the emergency isolation system, and the effectiveness of the blowdown (depressurization) system.
By multiplying the probabilities along each branch, analysts can calculate the final frequency of a specific outcome, such as a "Jet fire, not isolated." These diagrams are essential tools for understanding the full spectrum of possibilities for both vapor and liquid releases.
Once all the potential consequences have been modeled and their frequencies calculated, the results must be evaluated against established safety criteria.
To determine if a modeled fire or explosion poses a significant risk to assets, its effects (like heat radiation or overpressure) are compared against predefined "thresholds." If an event is predicted to exceed a threshold, it is considered a credible threat to equipment integrity.
|
Hazard |
Threshold for Asset Damage |
|
Jet Fire |
> 37.5 kW/m² for 5 minutes |
|
Pool Fire |
> 37.5 kW/m² for 10 minutes |
|
Explosion |
Multiple overpressure thresholds are used. Lower thresholds (e.g., 140 mbar) might be used to map the potential area of impact (frequency contours), while higher thresholds (e.g., 350 mbar) are used to assess severe structural damage. Other values are also calculated for informational purposes to provide a complete risk picture. |
Crucially, for any of these hazards to be considered in the final risk assessment, they must also be predicted to occur more frequently than a minimum threshold, typically once every 10,000 years (a frequency of 10⁻⁴ per year).
The final results of a FERA are often presented in tables that show the maximum distance at which these damage thresholds would be exceeded for various failure cases, providing a clear picture of the risk zones within the facility.
The Fire and Explosion Risk Analysis is a comprehensive safety study that can be summarized in three major phases:
We offer a full suite of HSEFS services designed to address your specific challenges and goals :
HSE Consulting & Advisory,
HSE Auditing & Assurance,
HSE Training & Development,
Implementation & Support,
Environmental Services
GST: 24ABDCA0826H1Z3
CIN: U71100GJ2025PTC163795
Copyright 2025. Agni Raksha Niti Engineering Consultancy Services Pvt. Ltd. All Rights Reserved.